Tuesday, March 2, 2021

Medical images

medical image types : anatomical images, functional images


The medical images can be divided into two main parts the anatomical images and the functional images.
  • Anatomical images: are intended to present the structure of an organ.
  • Functional images: are intended to present the functioning of an organ.
Anatomical images and functional images architecture

Anatomic imaging 

This kind of imaging allows the visualization of the structure of the organ.  

Magnetic Resonance Imaging (MRI)

MRI allows to observes the different parts of the body from every angle or direction, it has the ability to present a clear idea about the target. This type of scanner uses magnetic fields (it does not use x-rays). In order to focus on details, the radiologist can adjust various parameters according to the purpose. He can capture various sequences of MRI by a well-defined plan. In the scanning room, the patient must leave anything that can be attracted by the magnetic field such as rings, watches, mobile phones, etc. The images will be interpreted by the radiologist, then, the results will be sent to the doctor who requested them. Generally in MRI, the surface and the contour of the abnormal areas are in light gray color.

Magnetic Resonance Imaging (MRI)

Computerized Tomography (CT) 

A computerized tomography scan (CT or CAT scan), is a medical image acquisition machine that uses x-rays to create a series of x-rays images. It’s around a machine with a tunnel through the center. During the CT scan the gantry moves around the patient’s body to detect different views of the organ by x-rays, which will be sent to the computer to create the cross-sectional image. Before the examination (depending on the disease), the patient can drink a certain amount of oral contrast to highlight the organ in the image.

CT was invented by Hounsfield in 1973, it’s used in order to visualize the structural details of the organ by electromagnetic waves (X-rays). This type of image represents a set of successive x-rays images, thus enabling it to provide more detail than normal x-rays images. CT image can be recommended in various cases such as broken bones, heart disease, cancerous tumors, etc. CT image analysis helps to identify the treatment of the disease.

Computerized Tomography (CT) machine

Functional imaging

Allows to present the functioning of an organ by detecting different changes, for instance : metabolism, blood, change of oxygenation.

Positron Emission Tomography (PET) 

Can be used to detect brain activity, to run it, radioactive chemicals are injected into the bloodstream, giving the body energy in the form of gamma rays. It can accumulate more in the tumor areas. The short-lived radiotracer is made from fluorine-18 and simple sugar (glucose), the other radiotracer used is F-fluoroethyl-choline (FEC), the most widely used in prostate tumors. After an hour, the patient settles down for the examination, which lasts between 10 and 20 minutes. PET is essential for the diagnostic process, the staging of cancer disease, and the evaluation of the therapeutic response. Briefly presents the main stages.


Positron Emission Tomography (PET) machine


Single Photon Emission Computed Tomography (SPECT)

SPECT machine is used to detect tumors, stress fractures, infections, etc. It provides 3D images by rotating 360 degrees around the organ, which helps the computer to build a 3D image. The SPECT scan is a fusion of the CT scan and the SPEC scan to collect more precise details. The SPECT scan is the most used than the PET scan because it is less expensive, however, SPECT scan is slower than the PET scan because its radiotracer requires around 6 hours to achieve the expected effect.


Single Photon Emission Computed Tomography (SPECT) machine


Monday, March 1, 2021

Mean filter/ average filter (Filtre Moyenneur) - salt and pepper noise- implementation using python

Mean filter/ average filter  (Filtre Moyenneur) - salt and pepper noise- implementation using python

This filter reduces image noise and improves image smoothness. However, this allows for the fine details to not be visible or not very clear. Image noise can arise for a variety of causes, including physical factors such as camera temperature and brightness, and digital factors. There are many different kinds of image noise. Salt and pepper noise is one of the most well-known noises.

How to calculate the new pixel values?

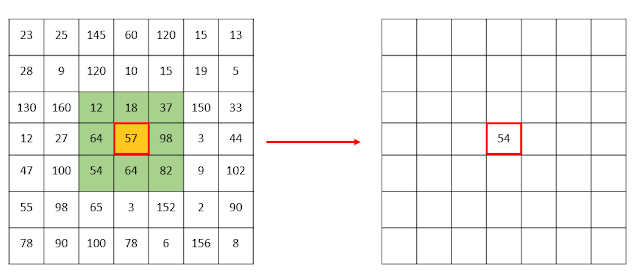
The averaging filter is a type of image processing. It is calculated using a weighted average of the pixels around each pixel. The new pixel is calculated from the old pixel and its neighbors, as illustrated in the figure below. For each pixel, this process will be repeated.

54 = (12+18+37+64+57+98+54+64+82)/9

How to calculate the new pixel values? convolution process

Implementation Using Python 

In this section, we give an easy demonstration using Python. 


Steps

  • The first step is to import the libraries to use;

from PIL import Image from PIL import ImageFilter 

  • The next step is to import the images;

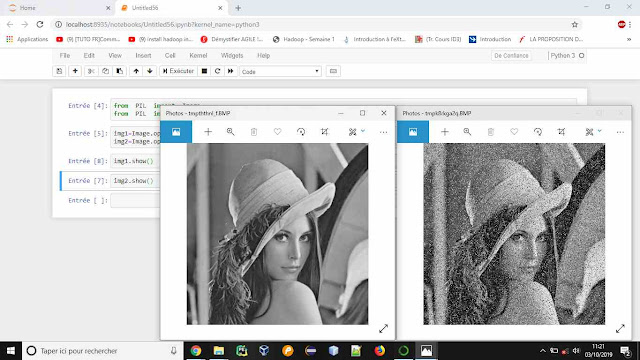
img1=Image.open("lena_original.png") img2=Image.open("lena_poivre_et_sel.png")
img1.show()
img2.show()

  • The last step is to apply the mean filter on the images using different threshold.

img2.filter(ImageFilter.BoxBlur(1)).show() img2.filter(ImageFilter.BoxBlur(3)).show() img2.filter(ImageFilter.BoxBlur(7)).show()


As a result, we can see that the Mean filter was successful in decreasing the salt and pepper noise, although the picture remained a bit unclear in comparison to the original image.

Sunday, February 28, 2021

Filtre Gaussien (Filtre Gaussien) - Implementation using Python

Filtre Gaussien (Gaussian Filter)  - Implementation using Python


Gaussian filter

Noise is a parasite that randomly presents in the image for physical (brightness, noise in hardware, sensor temperature, etc.) or digital (during image processing) reasons.

The Gaussian filter is a filter well known in the field of image processing which makes it possible to eliminate noise from a noisy image. It is based on a mathematical function g(x), which is frequently employed in statistical distributions.

Gaussian filter formula

In the case of a two-dimensional picture, x, and y:

Gaussian filter formula
With σ: standard derivation: presents the Gaussian bell width.
  • Sigma <1 is used to reduce noise in an image
  • Sigma> 1 is used to make an image for use in the unsharp mask.
The larger the sigma, the more remarkable the unsharp mask.

Implementation Using Python

In this part, we show how to apply a Gaussian filter to a noisy image using a basic demonstration, altering the radius value each time.


Steps

  • The first step is to import the libraries to use;

from PIL import Image
from PIL import ImageFilter

  • The next step is to import the images;

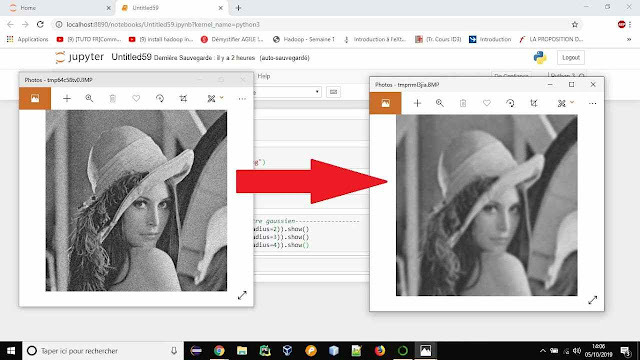
img1=Image.open("lena_original.png") img2=Image.open("lena_bruit_gaussien.png")
img1.show()
img2.show()

  • The last step is to apply the gaussian filter on the images using different threshold.

#--------------------------------- filtre gaussien------------------ img2.filter(ImageFilter.GaussianBlur(radius=2)).show() img2.filter(ImageFilter.GaussianBlur(radius=3)).show() img2.filter(ImageFilter.GaussianBlur(radius=4)).show()